Confidence interval for the difference between two means
The confidence interval for \(\mu_1 - \mu_2\) estimates the range of plausible values for the true difference between two population means. Whether to use a pooled or Welch approach depends on whether the population variances can be assumed equal.
Setup
We have two independent random samples (if the two samples are actually the same subjects measured twice, use the paired CI instead, it is more powerful):
- Group 1: \(n_1\) observations, sample mean \(\bar{X}_1\), sample variance \(S_1^2\).
- Group 2: \(n_2\) observations, sample mean \(\bar{X}_2\), sample variance \(S_2^2\).
The point estimate of \(\mu_1 - \mu_2\) is \(\bar{X}_1 - \bar{X}_2\). The CI takes the form:
\[(\bar{X}_1 - \bar{X}_2) \pm t^* \cdot \text{SE}(\bar{X}_1 - \bar{X}_2)\]
The two approaches differ in how they compute \(\text{SE}\) and the degrees of freedom for \(t^*\).
Welch’s interval (unequal variances)
When the population variances may differ, use Welch’s \(t\)-interval:
\[\text{SE} = \sqrt{\frac{S_1^2}{n_1} + \frac{S_2^2}{n_2}}\]
The degrees of freedom are given by the Satterthwaite approximation:
\[df = \frac{\left(\frac{S_1^2}{n_1} + \frac{S_2^2}{n_2}\right)^2}{\frac{(S_1^2/n_1)^2}{n_1-1} + \frac{(S_2^2/n_2)^2}{n_2-1}}\]
This is always a non-integer and must be rounded down. Welch’s interval is the default in R (t.test()) and most statistical software.
Pooled interval (equal variances)
When the population variances can be assumed equal (\(\sigma_1^2 = \sigma_2^2 = \sigma^2\)), pool the two sample variances into one estimate:
\[S_p^2 = \frac{(n_1-1)S_1^2 + (n_2-1)S_2^2}{n_1+n_2-2}\]
\[\text{SE} = S_p\sqrt{\frac{1}{n_1} + \frac{1}{n_2}}, \qquad df = n_1 + n_2 - 2\]
The pooled interval is slightly narrower than Welch when variances are truly equal, but can be misleading when they differ.
⚠️ Default to Welch: the equal variance assumption is rarely justified
Using the pooled interval when variances are unequal gives incorrect coverage: the actual CI may be narrower than stated and miss the true difference more often than the nominal \(\alpha\) level implies.
The rule “use pooled when \(n < 30\), use Welch when \(n \geq 30\)” is outdated and incorrect. The right rule: always use Welch unless there is a strong prior reason to assume equal variances (same instrument, same process, randomized experiment with equal allocation). In R, t.test(..., var.equal = FALSE) is the default and the correct choice in most situations.
Visualizing the two groups
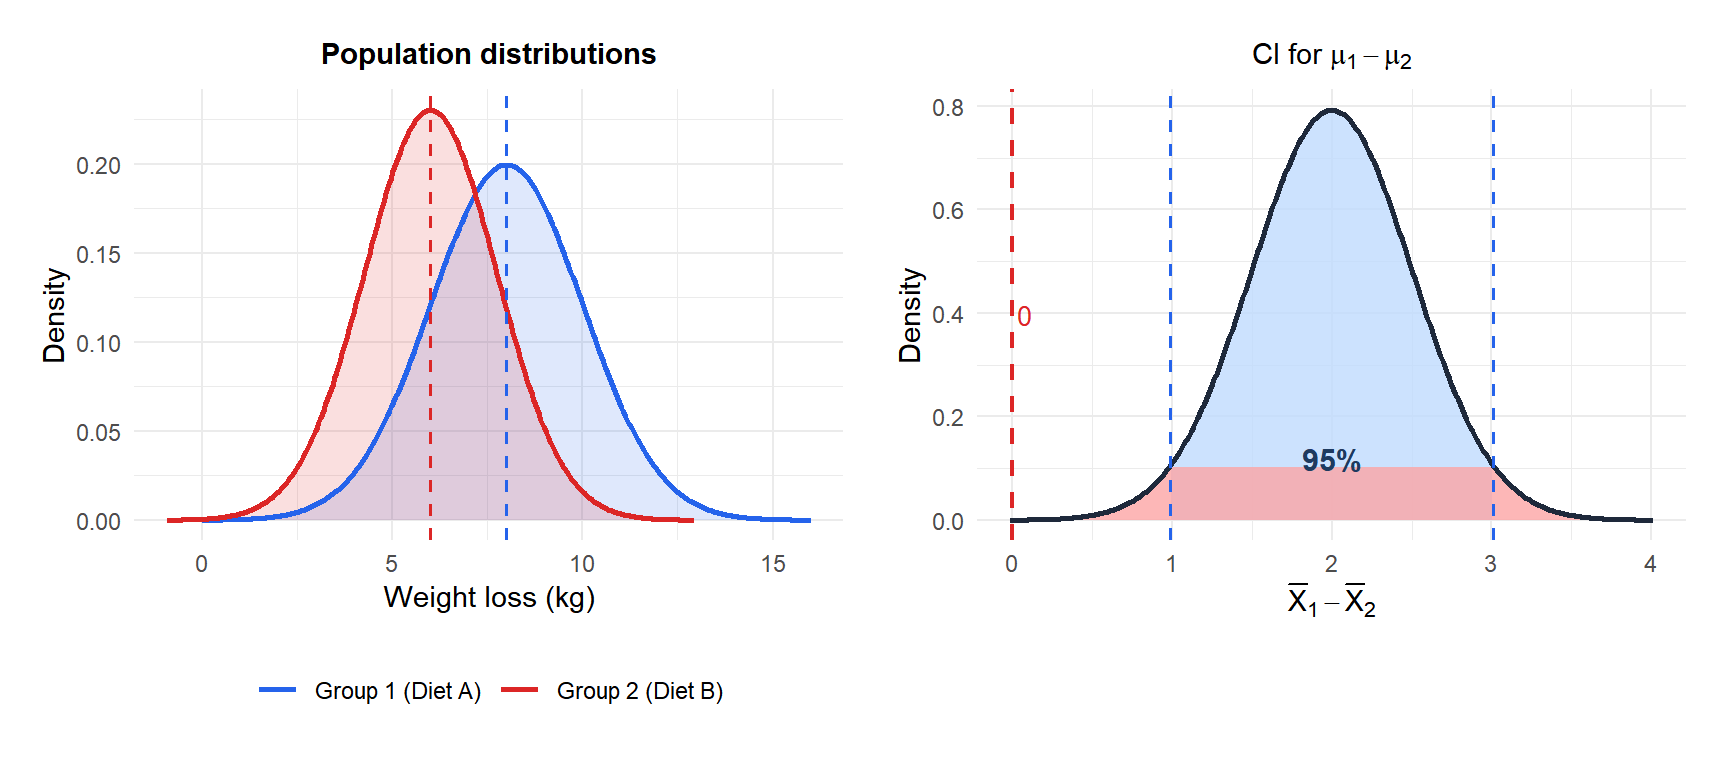
The right panel shows the sampling distribution of the difference \(\bar{X}_1 - \bar{X}_2\). The red dashed line at 0 represents “no difference”. Since 0 falls outside the 95% CI, the difference is statistically significant at the 5% level.
Step-by-step example
A clinical trial compares two diets over 6 months:
- Diet A: \(n_1 = 30\), \(\bar{x}_1 = 8.0\) kg, \(S_1 = 2.0\) kg.
- Diet B: \(n_2 = 25\), \(\bar{x}_2 = 6.0\) kg, \(S_2 = 1.73\) kg.
Construct a 95% CI for \(\mu_A - \mu_B\).
Step 1: compute the point estimate.
\[\bar{x}_1 - \bar{x}_2 = 8.0 - 6.0 = 2.0 \text{ kg}\]
Step 2: compute the Welch SE.
\[\text{SE} = \sqrt{\frac{4.0}{30} + \frac{3.0}{25}} = \sqrt{0.1333 + 0.1200} = \sqrt{0.2533} \approx 0.503 \text{ kg}\]
Step 3: Satterthwaite degrees of freedom.
\[df = \frac{0.2533^2}{\frac{(0.1333)^2}{29} + \frac{(0.1200)^2}{24}} = \frac{0.0641}{\frac{0.01777}{29} + \frac{0.0144}{24}} \approx \frac{0.0641}{0.000613 + 0.000600} \approx 52.8 \to 52\]
Step 4: critical value.
\[t_{0.025,\; 52} \approx 2.007\]
Step 5: construct the CI.
\[\text{CI} = 2.0 \pm 2.007 \times 0.503 = 2.0 \pm 1.01 = (0.99,\; 3.01) \text{ kg}\]
The CI does not include 0, so there is a statistically significant difference. Diet A produces between 0.99 and 3.01 kg more weight loss than Diet B, on average, with 95% confidence.
Same data as above but now assuming equal variances for the pooled approach:
\[S_p^2 = \frac{29 \times 4.0 + 24 \times 3.0}{53} = \frac{116 + 72}{53} = \frac{188}{53} \approx 3.547\]
\[\text{SE}_p = \sqrt{3.547 \times (1/30 + 1/25)} = \sqrt{3.547 \times 0.0733} \approx 0.510 \text{ kg}\]
\[df_p = 53, \quad t_{0.025,\; 53} \approx 2.006\]
\[\text{CI}_{\text{pooled}} = 2.0 \pm 2.006 \times 0.510 = (0.978,\; 3.022)\]
In this case the two intervals are nearly identical because \(S_1^2 \approx S_2^2\). When variances differ substantially, the gap between Welch and pooled intervals can be large.

💡 Interpreting the CI for a difference
Three cases tell the whole story:
- CI entirely above 0: \(\mu_1 > \mu_2\) is supported (Group 1 has a higher mean).
- CI entirely below 0: \(\mu_1 < \mu_2\) is supported (Group 2 has a higher mean).
- CI includes 0: the data are consistent with no difference at this confidence level.
A CI that just barely excludes 0 is very different from one that excludes it by a wide margin. Always report the actual interval, not just whether it includes 0.