Confusion matrix, precision, recall and F1-score
Every classification metric used to evaluate a model, accuracy, precision, recall, F1-score and more, is computed directly from just four numbers: the confusion matrix. This post covers the full anatomy of that matrix and every metric derived from it, for both binary and multi-class problems. Once you understand these metrics at a single threshold, the ROC curve and AUC summarize how they trade off as the threshold varies.
The confusion matrix
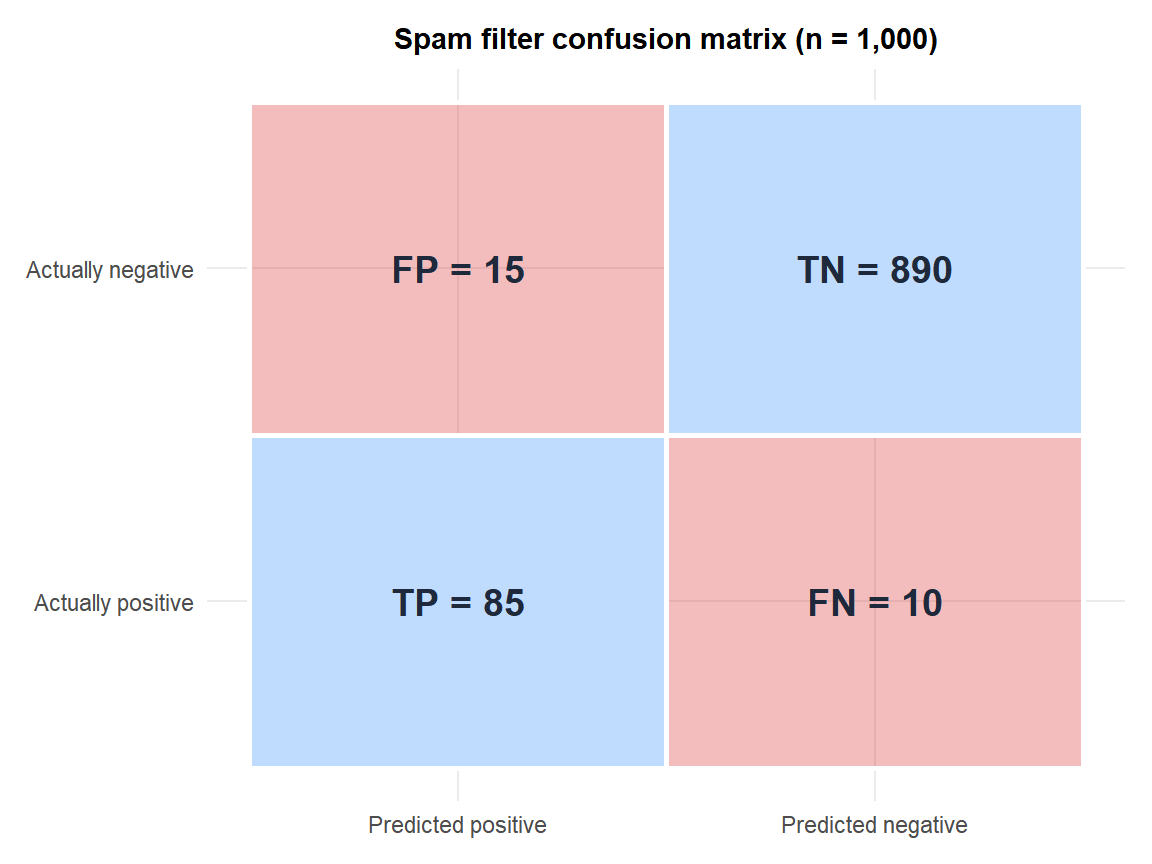
A binary classifier that has committed to a decision (positive or negative) can be compared against the true labels. Every observation falls into exactly one of four cells:
| Predicted positive | Predicted negative | |
|---|---|---|
| Actually positive | True Positive (TP) | False Negative (FN) |
| Actually negative | False Positive (FP) | True Negative (TN) |
A concrete framing makes the four cells easy to remember. Consider a spam filter deciding, for every incoming email, whether it is spam:
- True Positive (TP): spam correctly caught and routed to the spam folder.
- False Negative (FN): spam that slipped past the filter and landed in the inbox, a miss.
- False Positive (FP): a real, legitimate email wrongly sent to the spam folder, a false alarm.
- True Negative (TN): a real email correctly kept in the inbox.
Every metric in this post is nothing more than a different ratio computed from these four counts.
Metrics derived from the matrix
Each metric below is just a different ratio of the four cell counts above, but each one answers a distinct question about the classifier’s behavior.
\[\text{Accuracy} = \frac{TP+TN}{TP+FP+FN+TN} \qquad \text{Precision} = \frac{TP}{TP+FP}\] \[\text{Recall (Sensitivity)} = \frac{TP}{TP+FN} \qquad \text{Specificity} = \frac{TN}{TN+FP}\] \[F_1 = \frac{2 \cdot \text{Precision} \cdot \text{Recall}}{\text{Precision}+\text{Recall}}\]
Precision answers a false-alarm question: of everything I flagged positive, how much was actually correct? Recall answers a missed-case question: of everything that was actually positive, how much did I catch? The two trade off against each other: a model that flags everything as positive gets perfect recall (100%), because it never misses a true positive, but terrible precision, because most of its positive flags are wrong. A model that only flags the cases it is most sure about does the opposite: high precision, low recall.
\(F_1\) is the harmonic mean of precision and recall, not the arithmetic mean, and that choice is deliberate. The harmonic mean punishes a large imbalance between the two far more heavily than a simple average would, so a model cannot earn a good F1 score by being excellent at one and terrible at the other: both have to be reasonably good at the same time.
\[TP = 85 \qquad FP = 15 \qquad FN = 10 \qquad TN = 890 \qquad n = 1000\]
\[\text{Accuracy} = \frac{85+890}{1000} = 0.975 \qquad \text{Precision} = \frac{85}{85+15} = 0.850\] \[\text{Recall} = \frac{85}{85+10} = 0.8947 \qquad \text{Specificity} = \frac{890}{890+15} = 0.9834\] \[F_1 = \frac{2 \times 0.850 \times 0.8947}{0.850+0.8947} = 0.8718\]
Accuracy looks excellent (97.5%), but this dataset is imbalanced: only \(TP+FN=95\) of the 1000 emails are actually spam (9.5% prevalence). A trivial “always predict not-spam” classifier would score \(TN+FP = 905\) correct out of 1000, an accuracy of 0.905 (90.5%), just 7 percentage points below the real classifier, despite being completely useless (it never catches a single spam email, recall = 0). This is exactly why accuracy alone is a misleading headline number on imbalanced data: precision, recall and F1 tell the real story.

The multi-class case: macro, micro and weighted averaging
With more than two classes, there is no single confusion matrix cell to call “positive”. Instead, each class in turn is treated as “positive” and every other class as “negative” (one-vs-rest), which produces one precision, one recall and one F1 per class. Those per-class numbers then need to be combined into a single summary score, and there are three standard ways to do it.
\[\text{Macro-average} = \frac{1}{k}\sum_{i=1}^k \text{metric}_i\] \[\text{Weighted average} = \sum_{i=1}^k \frac{n_i}{n}\, \text{metric}_i\] \[\text{Micro-average} = \frac{\sum_i TP_i}{\sum_i TP_i + \sum_i FP_i}\]
Macro-average takes the unweighted mean across classes. Weighted average weights each class’s metric by its support \(n_i\). Micro-average pools every class’s TP/FP/FN first, before computing a single ratio, which for a multi-class single-label problem works out to be exactly the overall accuracy.
Confusion matrix (rows = actual class, columns = predicted class):
| Predicted Cat | Predicted Dog | Predicted Bird | Total (support) | |
|---|---|---|---|---|
| Actual Cat | 50 | 8 | 2 | 60 |
| Actual Dog | 5 | 40 | 5 | 50 |
| Actual Bird | 3 | 7 | 30 | 40 |
Per-class precision, recall and F1 (each class treated as “positive” in turn, e.g. for Cat: \(TP=50\), \(FP=5+3=8\), \(FN=8+2=10\)):
| Class | Precision | Recall | F1 | Support |
|---|---|---|---|---|
| Cat | 0.8621 | 0.8333 | 0.8475 | 60 |
| Dog | 0.7273 | 0.8000 | 0.7619 | 50 |
| Bird | 0.8108 | 0.7500 | 0.7792 | 40 |
Macro-average F1 \(= (0.8475+0.7619+0.7792)/3 = 0.7962\) (treats all three classes as equally important, regardless of how many examples of each there are).
Weighted-average F1 \(= (0.8475{\times}60 + 0.7619{\times}50 + 0.7792{\times}40)/150 = 0.8007\) (weights each class’s F1 by how common it is in the data, so it is dominated by performance on the majority classes).
Micro-average (= overall accuracy here) \(= (50+40+30)/150 = 0.8000\).
All three summary numbers answer a genuinely different question, and they can diverge a lot when class sizes are very unequal, always state explicitly which averaging method a reported metric uses.
⚠️ Macro-average can hide poor performance on rare classes, and vice versa
If one class is rare (small support) and the model performs terribly on it, MACRO-average F1 will reflect that poor performance clearly (every class counts equally, so one bad class visibly drags the macro average down), but WEIGHTED-average F1 (and plain accuracy) can look deceptively good, since the rare class barely moves a support-weighted number. This is exactly the same imbalanced-data trap as the binary spam example above, generalized to multiple classes: when a specific rare class matters a lot (e.g. detecting a rare disease subtype, or a rare type of fraud among several fraud categories), report the macro-average AND that specific class’s own precision/recall, not just an aggregate number that a majority class can dominate.
Running it in R
The binary metrics can be computed by hand from the four counts, but caret and yardstick handle the full binary and multi-class workflows, including macro/micro averaging, directly:
# Binary case
TP <- 85; FP <- 15; FN <- 10; TN <- 890
precision <- TP / (TP + FP)
recall    <- TP / (TP + FN)
f1        <- 2 * precision * recall / (precision + recall)

# Using caret on real predicted/actual label vectors
library(caret)
confusionMatrix(pred_labels, true_labels, positive = "spam", mode = "prec_recall")

# Multi-class: full per-class + macro/weighted summary
library(yardstick)
library(dplyr)
df <- data.frame(truth = factor(c("Cat","Cat","Dog","Bird")),
                  estimate = factor(c("Cat","Dog","Dog","Bird")))
df %>% yardstick::precision(truth, estimate, estimator = "macro")
df %>% yardstick::f_meas(truth, estimate, estimator = "macro")
df %>% yardstick::f_meas(truth, estimate, estimator = "micro")
💡 Which metric to optimize for
There is no single “best” metric, it depends entirely on the relative cost of the two error types. Optimize for RECALL when missing a positive case is expensive (medical screening for a serious disease, fraud detection where a missed fraud is very costly). Optimize for PRECISION when a false alarm is expensive (a spam filter that wrongly buries an important email, a recommendation system that shows irrelevant, annoying suggestions). Use F1 as a single balanced number when both error types matter roughly equally and you need one number to compare models or tune a threshold; but always also look at precision and recall separately, F1 alone can hide exactly which of the two is driving a low score.

