Regression vs correlation, what's the difference
Correlation and regression both describe how two variables move together, and people often use the words interchangeably, but they answer different questions. Correlation asks how strongly and in what direction two variables are associated. Regression asks what equation predicts one variable from the other. This post is the natural starting point before simple linear regression.
Two different questions
The Pearson correlation coefficient \(r\) summarizes the strength and direction of a linear association between two variables on a scale from \(-1\) to \(1\), with no notion of which variable, if either, causes or predicts the other. Regression instead fits a line (or a more complex curve) that lets you plug in one variable and get a predicted value for the other. Correlation is a single, symmetric number. Regression is an equation, and it depends on which variable you choose to predict.
Worked example: hours studied and exam score
The same small dataset, run through both a correlation and a regression, shows exactly how the two numbers relate.
A simulated class of \(n=30\) students records hours studied and the resulting exam score.
Correlation between hours studied and score: \(r = 0.791\).
Regression of score on hours, lm(score ~ hours):
| Coefficient | Estimate |
|---|---|
| Intercept | 44.66 |
| Slope (hours) | 4.10 |
The fitted line is \(\widehat{\text{score}} = 44.66 + 4.10 \times \text{hours}\): each extra hour studied is associated with about 4.1 more points, on average.

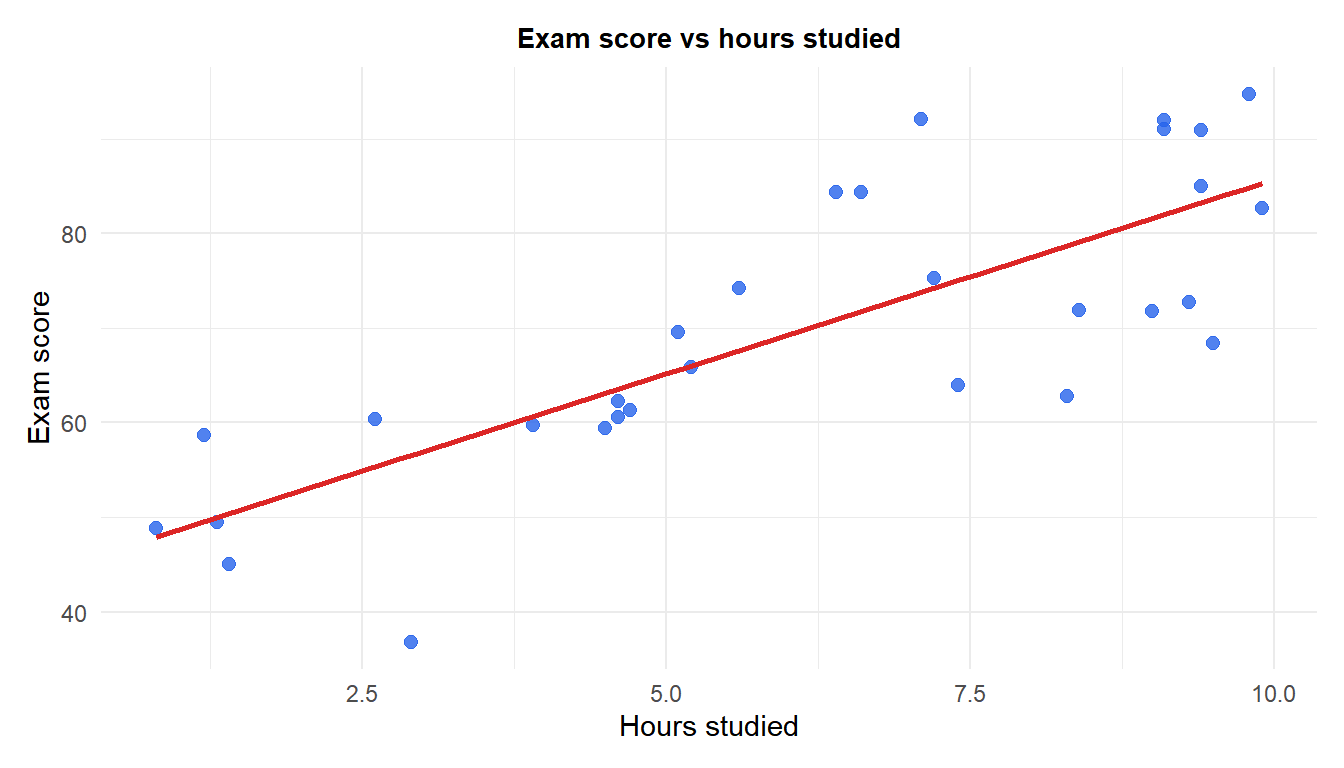
The bridge between the two numbers is direct. For simple linear regression, the slope is the correlation rescaled by the ratio of the standard deviations:
\[b_1 = r \cdot \frac{s_y}{s_x}\]
Here \(s_{\text{hours}} = 2.92\) and \(s_{\text{score}} = 15.18\), so \(b_1 = 0.791 \times \frac{15.18}{2.92} = 4.10\), exactly matching the fitted slope above. And for simple linear regression specifically, squaring the correlation gives the model’s R-squared: \(r^2 = 0.791^2 = 0.625\), which is exactly the \(R^2\) that lm() reports for this model.
Key structural differences
- Symmetry. Correlation is symmetric: \(\text{cor}(x,y) = \text{cor}(y,x)\). Regression is not: regressing score on hours gives a slope of 4.10, but regressing hours on score gives a completely different slope of 0.152, not simply its reciprocal (\(1/4.10 = 0.244\)). Which variable you call the predictor and which you call the outcome changes the equation.
- Units. Correlation is unitless and always between \(-1\) and \(1\), regardless of the scale of \(x\) and \(y\). Regression coefficients carry the units of the variables: the slope here is literally “points per hour”, and it changes if you rescale either variable (measuring hours in minutes would divide the slope by 60).
- What it gives you. Correlation gives you one number describing how tightly two variables move together. Regression gives you an actual equation you can use to generate a prediction for a new observation.
- Scope. Simple Pearson correlation only ever describes a pair of variables. Regression generalizes naturally to many predictors at once, see simple linear regression and its extension to multiple predictors.
⚠️ A high correlation does not make a regression trustworthy
A strong correlation, and the regression line built on top of it, only describes an association. Neither one tells you that hours studied causes the score to rise, some third factor (motivation, prior knowledge) could drive both. This is the same trap behind entirely meaningless but statistically strong correlations, explored in depth in The Correlation Files. Before trusting a regression line for prediction, also check that the relationship is reasonably linear and that no small set of points is dragging the fit around, see regression diagnostics.
Running it in R
Computing both side by side, and confirming that squared correlation matches R-squared, takes just a few lines:
💡 Correlation and regression in R
cor(hours, score)

fit <- lm(score ~ hours)
summary(fit)

# For simple linear regression, squared correlation equals R-squared
cor(hours, score)^2
summary(fit)$r.squared
