Levene's test
Levene’s test checks whether two or more groups have equal variances (homoscedasticity), without requiring the strong normality assumption that the F-test needs, which already introduced why the classical F-test is extremely sensitive to non-normality. It generalizes naturally to any number of groups and is the standard homoscedasticity check used in ANOVA before trusting the ANOVA F-test.
Hypotheses
Unlike the two-sample-only F-test, Levene’s test generalizes to \(k \geq 2\) groups:
\[H_0: \sigma_1^2 = \sigma_2^2 = \cdots = \sigma_k^2 \qquad H_1: \text{at least one } \sigma_i^2 \text{ differs}\]
A significant result means the assumption of equal variances is violated, which matters because the pooled two-sample t-test and standard one-way ANOVA both assume homoscedasticity.
How Levene’s test works
The key idea is to transform the problem of comparing variances into a problem of comparing means, which ordinary ANOVA machinery can already handle robustly. For each observation \(x_{ij}\) in group \(i\), compute the absolute deviation from its group center:
\[Z_{ij} = |x_{ij} - \bar{x}_i|\]
where \(\bar{x}_i\) is the group mean (classical Levene) or the group median (the Brown-Forsythe variant, more robust to outliers and skewed data). Two simple ideas justify this transformation:
- If a group’s values are tightly clustered around its center, the resulting \(Z_{ij}\) will be small and fairly consistent.
- If a group’s values are spread out, the \(Z_{ij}\) will be larger and more variable.
Groups with genuinely different amounts of spread therefore produce different average \(Z_{ij}\), which is exactly what an ordinary one-way ANOVA is designed to detect. Run that ANOVA F-test on the \(Z_{ij}\) values instead of the raw data:
\[W = \frac{(N-k)}{(k-1)} \cdot \frac{\sum_{i=1}^k n_i (\bar{Z}_i - \bar{Z})^2}{\sum_{i=1}^k \sum_{j=1}^{n_i} (Z_{ij} - \bar{Z}_i)^2}\]
Under \(H_0\), \(W \sim F(k-1, N-k)\): exactly the same reference distribution as an ordinary ANOVA F-test, because that is what is being computed, just on the transformed \(Z\) values.
Worked example: three production lines
Applying the mean-centering step from above to real measurements makes the whole procedure concrete:
Three machines each produce 5 units; quality engineers measure a dimension (mm) to check whether the machines are equally consistent (not whether their averages differ, ANOVA would test that, this test asks about spread):
- Machine A: 23, 25, 24, 26, 22 (\(\bar{x}_A = 24\), \(s_A^2 = 2.5\))
- Machine B: 20, 30, 15, 35, 25 (\(\bar{x}_B = 25\), \(s_B^2 = 62.5\))
- Machine C: 24, 24, 25, 23, 24 (\(\bar{x}_C = 24\), \(s_C^2 = 0.5\))
Step 1: absolute deviations from each group mean
| Machine A | Machine B | Machine C | |
|---|---|---|---|
| \(Z_{i1}\) | 1 | 5 | 0 |
| \(Z_{i2}\) | 1 | 5 | 0 |
| \(Z_{i3}\) | 0 | 10 | 1 |
| \(Z_{i4}\) | 2 | 10 | 1 |
| \(Z_{i5}\) | 2 | 0 | 0 |
| \(\bar{Z}_i\) | 1.2 | 6.0 | 0.4 |
Grand mean of all \(Z_{ij}\): \(\bar{Z} = 2.5\overline{3}\).
Step 2: run the one-way ANOVA F-test on the \(Z_{ij}\)
| Source | SS | df | MS | F | p-value |
|---|---|---|---|---|---|
| Between groups | 91.733 | 2 | 45.867 | 7.438 | 0.00792 |
| Within groups | 74.000 | 12 | 6.167 | ||
| Total | 165.733 | 14 |
\[W = \frac{91.733/2}{74.0/12} = \frac{45.867}{6.167} = 7.438\]
\(p\)-value = 0.00792. Critical value \(F_{0.05,2,12} = 3.885\).
Decision: since \(W = 7.438 > 3.885\) (and \(p < 0.05\)), reject \(H_0\). The three machines do NOT have equal variance: Machine B is far more erratic than A or C.

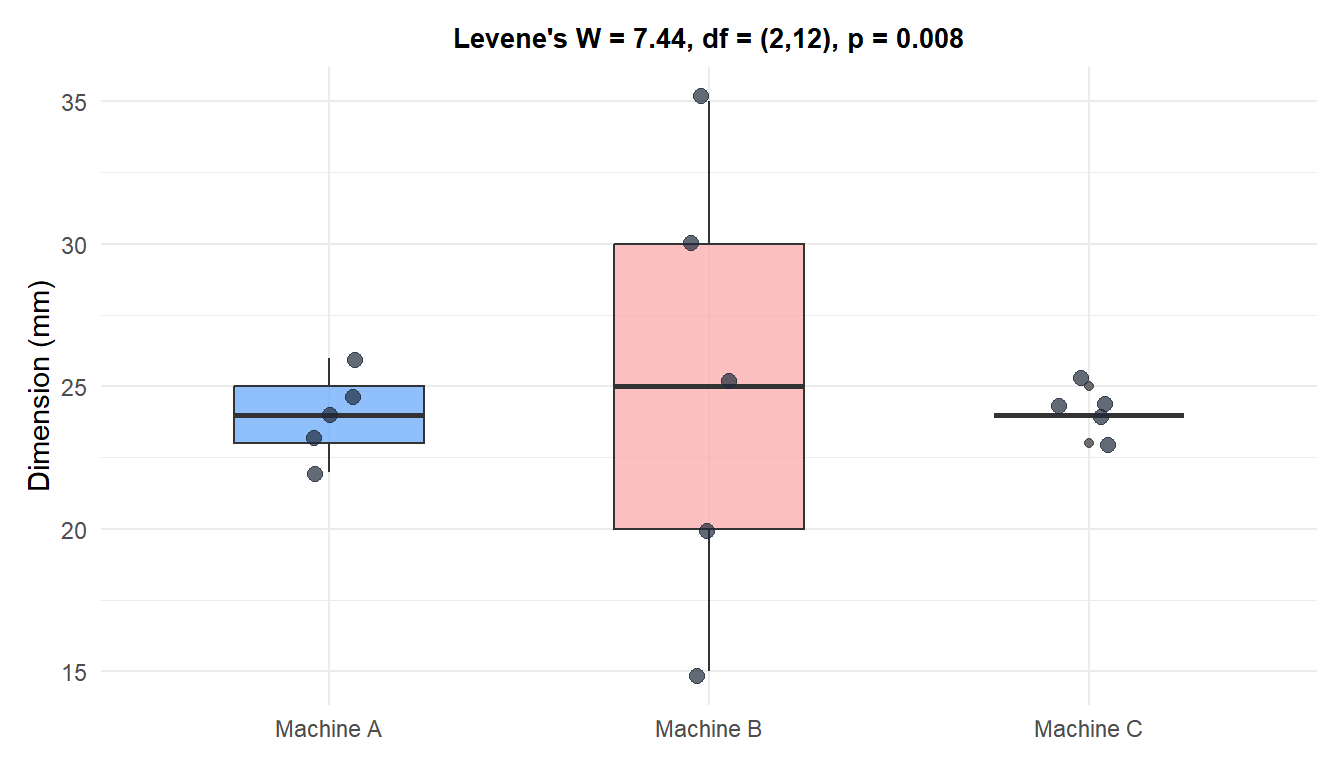
The three machines’ centers look similar, but Machine B’s box and whiskers are far wider than A’s or C’s: exactly the pattern that drives the significant \(W\) statistic.
Levene vs Brown-Forsythe
The classical version above centers each group on its mean. The Brown-Forsythe variant centers each group on its median instead:
\[Z_{ij} = |x_{ij} - \tilde{x}_i|\]
The median-centered variant is generally preferred for skewed data or data with outliers, because the median is a more robust measure of center than the mean. For the production-line example above, the group medians happen to sit close to the group means since the three groups are fairly symmetric, so both variants give essentially the same result, but in general they can differ meaningfully: a single extreme value can pull a group’s mean substantially while barely moving its median, so Brown-Forsythe stays more stable in that situation.
| Classical Levene | Brown-Forsythe | |
|---|---|---|
| Center used | Group mean | Group median |
| Robustness to outliers | Moderate | High |
| Robustness to skewed data | Moderate | High |
| Power when data are normal | Slightly higher | Slightly lower |
car::leveneTest() argument |
center = mean |
center = median (package default) |
⚠️ Levene's test only tells you variances differ, not which pairs, and it is itself a preliminary check, not the main question
A significant Levene’s test says “the assumption of equal variances is violated” (useful for deciding whether to trust a pooled t-test or standard ANOVA), it does NOT by itself identify which groups differ, or how large the practical difference in spread is. For the numeric magnitude, report the group variances or standard deviations directly alongside the test (as done above: 2.5 vs 62.5 vs 0.5 is a large practical difference, not just a statistically significant one). Also remember: Levene’s test being non-significant does not “prove” equal variances, it only means there was not enough evidence against that assumption, the same logic that applies to every hypothesis test’s null result.
Assumptions
Levene’s test requires much less than the F-test, but it is not assumption-free:
- Independence: observations must be independent within and across groups, exactly as for the F-test and ANOVA.
- No strict normality requirement: this is the entire point of the test. Running an ordinary ANOVA on the \(Z_{ij}\) is reasonably robust to the raw data’s distribution shape, which is why Levene’s test tolerates skewness and heavy tails far better than the F-test or Bartlett’s test.
- Reasonable sample sizes per group: with very small \(n_i\), as in the example above (\(n_i = 5\)), the test still runs correctly, but its power to detect genuine variance differences is limited. Larger samples make the test more sensitive to real differences in spread.
Because of this light assumption set, Levene’s test is the homoscedasticity check most statistical software runs by default before trusting a pooled t-test or a standard ANOVA F-test.
Levene’s test compared to other variance tests
| Test | Groups | Requires normality | Robustness to outliers |
|---|---|---|---|
F-test (var.test()) |
2 only | Yes, strictly | Low |
| Bartlett’s test | 2 or more | Yes, strictly | Low |
| Levene’s test (mean-centered) | 2 or more | No | Moderate |
| Brown-Forsythe (median-centered) | 2 or more | No | High |
Bartlett’s test generalizes the F-test’s logic to more than two groups, but inherits the same fragility: with non-normal data it can reject “equal variances” even when the true population variances match, simply because the data are skewed or heavy-tailed. Levene’s test avoids this trap by never assuming a distribution for the raw data, it only relies on the transformed \(Z_{ij}\) values feeding into an ordinary, robust ANOVA.
Running the test in R
car::leveneTest() runs both the classical and Brown-Forsythe variants, and a manual aov() call on the deviations confirms it matches the by-hand result above exactly:
values <- c(23,25,24,26,22, 20,30,15,35,25, 24,24,25,23,24)
group  <- factor(rep(c("A","B","C"), each = 5))

library(car)
leveneTest(values ~ group, center = mean)     # classical Levene's test
leveneTest(values ~ group, center = median)   # Brown-Forsythe variant

# Manual verification (matches leveneTest exactly)
Z <- ave(values, group, FUN = function(x) abs(x - mean(x)))
summary(aov(Z ~ group))
leveneTest() reports the same \(F\), \(df\), and \(p\)-value computed by hand above: \(F = 7.438\) on \((2, 12)\) degrees of freedom, \(p = 0.00792\). The manual aov(Z ~ group) call matches it exactly, because leveneTest() is, under the hood, precisely this ANOVA applied to the absolute deviations.
💡 When to reach for Levene's test
Run Levene’s test whenever you plan to use a method that assumes equal variances (a pooled two-sample t-test, or standard one-way ANOVA) and are not fully confident the data are normal.
- Levene’s test rejects \(H_0\): switch to Welch’s t-test (which does not assume equal variances) instead of the pooled t-test, or Welch’s ANOVA instead of standard ANOVA.
- Data are verified normal: the classical F-test is an equally valid, slightly more powerful alternative for the two-group case.
- Data are skewed or contain outliers: prefer the median-centered Brown-Forsythe variant (
center = median) over classical Levene. - Normality is uncertain or untested, which is the common case in practice: Levene’s test is the safer default, since it costs little power relative to the F-test or Bartlett’s test when the data really are normal, and avoids their false rejections when the data are not.

